Even simple organic molecules contain many bonds and have complex IR spectra. The IR spectrum of each molecule is different and can be used to identify it if its spectrum is on a database or library (see '
Fingerprint Region'). However, the IR spectra of related molecules often absorb at very similar and distinctive wavenumbers. The energy required to vibrate a functional group such as a carbonyl (C=O) or alcohol (O-H) is often very similar in different compounds and so molecules containing these functional groups show IR bands at wavenumbers which are characteristic of these groups. This leads to the most common and important use of IR spectroscopy in organic and biochemistry:
IR spectoscopy can be used to indicate the presence and absence of functional groups in organic compounds.
Alongside the wavenumber of the absorption (the x- axis on the IR spectrum), the amount of IR radiation absorbed (the y-axis on the IR spectrum) can also be characteristic of the functional group.
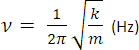
A bond connecting 2 atoms acts rather like a spring connecting 2 masses. When it is stretched or compressed, there is a restoring force that acts to pull the atoms back. The vibrational frequency of a bond is given by the formula opposite where k is the bond force constant and m is the effective mass of the atoms. Bonds which are strong act like springs which are stiff: k is large and so is the vibrational frequency (and wavenumber). When the mass of the atoms is small, the vibrational frequency (and wavenumber) tends to be high. Hence:
- Vibrational frequencies (and wavenumbers) increase in the order: single < double < triple,
- Vibrational frequencies (and wavenumbers) for bonds involving the lightest element, H, are high and
- In general, it is harder to stretch than to bend so stretching vibrations tend to occur at higher frequencies (and wavenumbers) than bends.
|
|
vibrational frequency |
|
vibrational wavenumber |
The table below lists the characteristic IR absorptions of some common functional groups. When presented with the IR spectrum of an unknown compound, a table such as this can be consulted to work out which functional groups are present. Often as importantly, the absence of a characteristic band can be used to work out which functional groups are not present. For example, if a compound is known to contain oxygen, the IR spectrum can often quickly clarify whether it is an alcohol, carbonyl or carboxylic acid group. If the bands expected for such groups are all absent, then it is likely that those groups are also absent.
| Functional Group |
Absorption
(cm-1) |
Intensity |
Comments |
| Alkane |
|
|
|
| C-H |
2850 - 2960 |
Medium |
Sharp |
| Alkene |
|
|
|
| =C-H |
3020 - 3100 |
Medium |
|
| C=C |
1640 - 1680 |
Medium |
|
| Alkyne |
|
|
|
| ≡C-H |
3300 |
Strong |
|
| C≡C |
2100 - 2260 |
Medium |
|
| Alkyl halide |
|
|
|
| C-Cl |
600 - 800 |
Strong |
|
| C-Br |
500 - 600 |
Strong |
|
| Alcohol |
|
|
|
| O-H |
3400 - 3650 |
Strong |
Often broad |
| C-O |
1050 - 1150 |
Strong |
|
| Arene |
|
|
|
| C-H |
3030 |
Weak |
|
| C=C |
1660 - 2000 |
Weak |
|
| C=C |
1450 - 1600 |
Weak |
|
|
|
| Functional Group |
Absorption
(cm-1) |
Intensity |
Comments |
| Amine |
|
|
|
| N-H |
3300 - 3500 |
Medium |
Often broad |
| C-N |
1030 - 1230 |
Medium |
|
| Aldehyde and ketone |
|
|
| C=O |
1670 - 1800 |
Strong |
|
| Carboxylic acid |
|
|
|
| C=O |
1660 - 1740 |
Strong |
|
| O-H |
2500 - 3200 |
Strong |
Often broad |
| Ester |
|
|
|
| C=O |
1670 - 1750 |
Strong |
|
| Amide |
|
|
|
| C=O |
1630 - 1690 |
|
|
| N-H |
3140 - 3500 |
Strong |
1°: two bands
2°: one band |
| Nitrile |
|
|
|
| C≡N |
2210 - 2260 |
Medium |
|
| Nitro |
|
|
|
| NO2 |
1540 |
Strong |
|
|
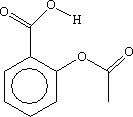
The spectrum below is that of aspirin, shown opposite. The molecule contains:
- 2 carbonyl groups (one in the carboxylic acid group at the top and one in the ester group on the right). There is a single, broad band at just under 1800 cm-1 in the spectrum. The table above shows that this is consistent with C=O stretching vibrations. Click on the left and right hand sides of the band to see the molecular vibrations which are excited at these wavenumbers. You will see that both C=O groups vibrate at the same time. You can rotate the molecule using your mouse.
- It also contains an O-H goup in the carboxylic acid group. There is a band at around 3200 cm-1 in the spectrum. The table above shows that this is consistent with an O-H stretching vibration. Click on the band to see the molecular vibration. You can rotate the molecule using your mouse.
- Click on the other bands in the spectrum to see the corresponding vibrations.
|
|
 aspirin
|
|